In this part we will install the components and quickly check out some of the features in the Cilium Service Mesh to get a glimpse of the current state.
My employer (Conoa) run a weekly meetup channel where we (the tech people) have an opportunity to talk about whatever interests us in the cloud native space.
I was asked if I could arrange a talk during the last Thursday of may about something that have caught my interest and I agreed to do it if I could choose to talk about Cilium (for those that know me, it was perhaps no bigger surprise as I happen to like this project and the folks behind it).
I had almost a week to prepare a demo (mostly based on the https://github.com/isovalent/cilium-grafana-observability-demo and from what I’ve seen in the awesome labs available at https://isovalent.com/resource-library/labs/ — unfortunately there are not so much fresh code in GH as I would like) about the Service Mesh (in Swedish).
Unfortunately, with limited time I was only showing a subset of what I initially had in mind, but at least I managed to put up a demo and the Demo Gods were quite nice to me:
The demo preparations was done in my ordinary environment, which happens to run an external Control Plane (in my port of Kubernetes to illumos), placed in another network segment (VLAN) than the Data Plane.
While I had in mind to run my demos in that environment, I felt that it would perhaps have been counter-intuitive to demonstrate an environment that lacks components that most(?) Kubernetes users would perhaps expect to be there:
$ kubectl get pod -n kube-system
NAME                               READY   STATUS                 RESTARTS   AGE
cilium-bdvbd                       1/1     Running                0          21h
cilium-m6dgf                       1/1     Running                0          21h
cilium-operator-78ff8866bf-k98zq   1/1     Running                0          21h
cilium-operator-78ff8866bf-tjvhx   1/1     Running                0          21h
coredns-5f47698cfc-5nkr7           1/1     Running                0          26h
coredns-5f47698cfc-qhnl9           1/1     Running                0          26h
hubble-relay-5447546447-sqcsm      1/1     Running                0          21h
hubble-ui-694cf76f4c-m4fg4         2/2     Running                0          21h
With that in mind it still wouldn’t stop me from at least preparing and testing out the concepts in my “managed” Kubernetes solution, if it works there, it works almost anywhere?
The steps involved will still be the same, except for the BGP configuration (which will be environment specific anyway) where I try to steer traffic more directly between the network zones (VLANs), without passing through other network zones.
The output in Hubble, however, will be a bit different as it will display more components.
Creating a demo environment
Prerequisites
-
Working control plane (see my earlier articles on how to set it up, it still holds up until now in concepts. There are some differences where this article installs components, just skip those parts in the old articles.).
$ kubectl version —output=yaml clientVersion: buildDate: “2023-04-14T18:51:06Z” compiler: gc gitCommit: dc6760b58d10b77ce10082dcfbdb4c4c9f3d61df gitTreeState: clean gitVersion: v1.27.1-1+dc6760b58d10b7 goVersion: go1.20.2 major: “1” minor: 27+ platform: illumos/amd64 kustomizeVersion: v5.0.1 serverVersion: buildDate: “2023-04-14T18:52:09Z” compiler: gc gitCommit: dc6760b58d10b77ce10082dcfbdb4c4c9f3d61df gitTreeState: clean gitVersion: v1.27.1-1+dc6760b58d10b7 goVersion: go1.20.2 major: “1” minor: 27+ platform: illumos/amd64
-
Worker nodes with Linux (I’ve opted for Ubuntu 22.04 LTS) with Kubernetes v1.27.x and CRI (I’ve chosen CRI-O) set up.
-
BGP
-
Prometheus Operator CRD in order to utilize Service Monitors (to facilitate scraping)
-
Gateway API spec (v0.5.1) CRD
Working control plane — and worker nodes
This (friend links, no paywall) are the concepts for getting the control plane up and running, as well as bringing the worker nodes up. (they will be imported here in time):
Build a managed Kubernetes cluster from scratch — part 1
Build a managed Kubernetes cluster from scratch — part 2
Build a managed Kubernetes cluster from scratch — part 3
Build a managed Kubernetes cluster from scratch — part 4
Build a managed Kubernetes cluster from scratch — part 5
BGP
This configuration is in no way “production ready” as it has no security, but for demonstration purposes it show how BGP can be implemented and enable it in the cluster.
To explain how the configuration ended up in this way, some background is needed:
In order to have the control plane being able to talk with the internal services I’ve had some challenges:
#1: I looked into on how to integrate with the VXLAN, but I saw no easy way to implement it. #2: Next up I had the admission controllers listening on host ports and patched the webhooks to talk url to a external load balancer which pointed to each worker node instead of the ordinaryservice, which mostly by the way worked rather good on various projects. I had Longhorn working stable. Then came Longhorn v1.3+ which relied on even more webhooks and I realised that it wouldn’t be realistic to maintain. #3: VTEP, still VXLAN, but it would at least be a defined state. However good, it would still be a single worker node (if I’ve understood the concept correctly). #4: Current state. I simply announce the ClusterIP to the kube-apiserver and route it back to the workers. What’s not so good is that each individual worker node needs to be defined.
This is the configuration in its current state:
K8S_CLUSTERIP_CIDR=
K8S_ROUTER_ASN=
K8S_LB_CIDR=
WORKER1_NODE_IP=
WORKER2_NODE_IP=
WORKER3_NODE_IP=
WORKER_NODE_CIDR=
LOCAL_ROUTER_ASN=
LOCAL_ROUTER_ID=
LOCAL_ROUTER_NAME=
UPSTREAM_ROUTER_ASN=
UPSTREAM_ROUTER_ID=

cat << EOF > /etc/frr/frr.conf
frr version 7.5
frr defaults traditional
hostname ${LOCAL_ROUTER_NAME}
log syslog
no ipv6 forwarding
service integrated-vtysh-config
!
ip route ${K8S_CLUSTERIP_CIDR} ${WORKER1_NODE_IP}
ip route ${K8S_CLUSTERIP_CIDR} ${WORKER2_NODE_IP}
ip route ${K8S_CLUSTERIP_CIDR} ${WORKER3_NODE_IP}
!
router bgp ${LOCAL_ROUTER_ASN}
 bgp router-id ${LOCAL_ROUTER_ID}
 bgp log-neighbor-changes
 bgp bestpath as-path multipath-relax
 neighbor ${UPSTREAM_ROUTER_ID} remote-as ${UPSTREAM_ROUTER_ASN}
 neighbor K8S peer-group
 neighbor K8S remote-as ${K8S_ROUTER_ASN}
 neighbor K8S capability extended-nexthop
 neighbor K8S update-source ${LOCAL_ROUTER_ID}
 neighbor ${WORKER_NODE_CIDR} peer-group K8S
 bgp listen range ${WORKER_NODE_CIDR} peer-group K8S
!
 address-family ipv4 unicast
  redistribute connected
  neighbor K8S route-map IMPORT in
  neighbor K8S route-map EXPORT out
  network ${K8S_LB_CIDR}
  network ${K8S_CLUSTERIP_CIDR}
  network ${WORKER_NODE_CIDR}
  neighbor ${UPSTREAM_ROUTER_ID} soft-reconfiguration inbound
  neighbor ${UPSTREAM_ROUTER_ID} route-map ALLOW-ALL in
  neighbor ${UPSTREAM_ROUTER_ID} route-map ALLOW-ALL out
  neighbor K8S route-map ALLOW-ALL in
  neighbor K8S route-map ALLOW-ALL out
 exit-address-family
!
route-map ALLOW-ALL permit 100
!
line vty
!
EOF
After the basic definition, we simply create static routes to the worker nodes. Then (as I have several BGP peers in my home infrastructure), I declare BGP peers both upstream (my router) and downstream (the kubernetes cluster). Lastly, among the (no) filters, I define what networks I chose to announce further.
Prometheus Operator CRD
As we will deploy Cilium with resources of kind ServiceMonitors that define what Prometheus Operator should scrape, we should create those CRD beforehand.
helm repo add prometheus-community https://prometheus-community.github.io/helm-charts
helm template kube-prometheus prometheus-community/kube-prometheus-stack --include-crds \
  | yq 'select(.kind == "CustomResourceDefinition") * {"metadata": {"annotations": {"meta.helm.sh/release-name": "kube-prometheus", "meta.helm.sh/release-namespace": "monitoring"}}}' \
  | kubectl create -f -
Gateway API CRD v0.5.1
While it appears not strictly necessary to install before Cilium (or rather, when we deploy a Gateway or HTTPRoute), but it makes no sense to delay what’s necessary. Gateway API Support - Cilium 1.13.3 documentation
kubectl apply -f https://raw.githubusercontent.com/kubernetes-sigs/gateway-api/v0.5.1/config/crd/standard/gateway.networking.k8s.io_gatewayclasses.yaml
kubectl apply -f https://raw.githubusercontent.com/kubernetes-sigs/gateway-api/v0.5.1/config/crd/standard/gateway.networking.k8s.io_gateways.yaml
kubectl apply -f https://raw.githubusercontent.com/kubernetes-sigs/gateway-api/v0.5.1/config/crd/standard/gateway.networking.k8s.io_httproutes.yaml
kubectl apply -f https://raw.githubusercontent.com/kubernetes-sigs/gateway-api/v0.5.1/config/crd/experimental/gateway.networking.k8s.io_referencegrants.yaml
Installing Cilium v1.13.x
We are deploying Cilium with a multitude of options set.
-
Enable the GoBGP based BGP Control Plane.
-
Enable Cilium Ingress Controller.
-
Enable Cilium Gateway API.
-
Define the Cluster CIDR.
-
Install Prometheus Operator ServiceMonitor.
-
Install Hubble HTTP L7 Dashboard with a defined set of metrics enabled (including policy visualization for Cilium Network Policies).
-
Enable “strict” mode (kube-proxy free installation)
-
The observant will see bpf.lbExternalClusterIP. While an anti-pattern, it is a life saver for me that Cilium provides this fantastic possibility as it do enable me to segment the Control Plane to live outside of Data Plane.
CLUSTERCIDR=10.0.0.0/16 K8SAPISERVER=10.12.13.14
helm install cilium cilium/cilium —version 1.13.3
—namespace kube-system
—set bgpControlPlane.enabled=true
—set ingressController.enabled=true
—set bpf.lbExternalClusterIP=true
—set gatewayAPI.enabled=true
—set bpf.masquerade=true
—set cluster.id=1
—set cluster.name=democluster1
—set ipam.mode=kubernetes
—set ipv4NativeRoutingCIDR=${CLUSTERCIDR}
—set k8sServiceHost=${K8SAPISERVER}
—set k8sServicePort=6443
—set kubeProxyReplacement=strict
—set tunnel=vxlan
—set operator.prometheus.enabled=true
—set operator.prometheus.serviceMonitor.enabled=true
—set prometheus.enabled=true
—set prometheus.serviceMonitor.enabled=true
—set hubble.relay.enabled=true
—set hubble.ui.enabled=true
—set hubble.metrics.dashboards.enabled=true
—set hubble.metrics.dashboards.namespace=monitoring
—set hubble.metrics.dashboards.annotations.grafana_folder=Hubble
—set hubble.metrics.enableOpenMetrics=true
—set hubble.metrics.enabled=“{dns,drop,tcp,flow:sourceContext=workload-name|reserved-identity;destinationContext=workload-name|reserved-identity,port-distribution,icmp,kafka:labelsContext=source_namespace,source_workload,destination_namespace,destination_workload,traffic_direction;sourceContext=workload-name|reserved-identity;destinationContext=workload-name|reserved-identity,policy:sourceContext=app|workload-name|pod|reserved-identity;destinationContext=app|workload-name|pod|dns|reserved-identity;labelsContext=source_namespace,destination_namespace,httpV2:exemplars=true;labelsContext=source_ip,source_namespace,source_workload,destination_ip,destination_namespace,destination_workload,traffic_direction}”,
—set hubble.enabled=true
—set hubble.metrics.serviceMonitor.enabled=true
Install ExternalDNS
ExternalDNS should support Gateway API as of now but I initially had no success on getting the —source=gateway-httproute to work properly, it turned out to be due to missing rbac permissions (the namespaces resource was missing but should be in place in v0.13.5).
The configuration is really out of scope here (as it depends on your DNS hosting), but I show a configuration that has been working for me with RFC2136.
helm repo add external-dns https://kubernetes-sigs.github.io/external-dns/Then define the values that are appropriate for your environment.
PROVIDER=rfc2136
DNSHOST=10.53.0.2 # Your internal DNS resolver
DNSZONE=your.domain.com # The zone that DNS manages
TSIGSECRET=<TSIG Secret at the DNS server, check named.conf>
TSIGALGO=hmac-sha256 # TSIG algorithm chosen at DNS server
TSIGKEY=externaldns # The TSIG name chosen at DNS server
DOMAINFILTER=your.domain.com # Which sub domains the ExternalDNS handles

$ cat <<EOF | helm upgrade --install -n external-dns external-dns \
external-dns/external-dns --create-namespace  -f -
---
serviceAccount:
  create: true

rbac:
  create: true

securityContext:
  runAsNonRoot: true
  runAsUser: 65534
  allowPrivilegeEscalation: false
  readOnlyRootFilesystem: true
  capabilities:
    drop: ["ALL"]

sources:
  - service
  - ingress
  - httprouter

registry: txt
txtOwnerId: "k8s"
txtPrefix: "external-dns-"

domainFilters:
  - ${DOMAINFILTER}

provider: ${PROVIDER}

deploymentStrategy:
  type: Recreate

extraArgs:
  - --rfc2136-host=${DNSHOST}
  - --rfc2136-port=53
  - --rfc2136-zone=${DNSZONE}
  - --rfc2136-tsig-secret=${TSIGSECRET}
  - --rfc2136-tsig-secret-alg=${TSIGALGO}
  - --rfc2136-tsig-keyname=${TSIGKEY}
  - --rfc2136-tsig-axfr
EOF
Installation of Cert Manager
Cert Manager is out of scope, as it depends on how your domain is hosted, but to facilitate TLS certificates in the cluster it is handy to deal it with Cert Manager.
Basically the installation is like this (and then a Issuer/ClusterIssuer needs to be set up). The extra arguments are needed for GatewayAPI (as it is still considered “experimental”) and for split DNS setup (it you, like me, have internal and external DNS servers serving the clients).
helm repo add jetstack https://charts.jetstack.io
helm repo update
helm install cert-manager jetstack/cert-manager \
--namespace cert-manager \
--create-namespace \
--set "extraArgs={\
--feature-gates=ExperimentalGatewayAPISupport=true,\
--dns01-recursive-nameservers-only,\
--dns01-recursive-nameservers=8.8.8.8:53\,1.1.1.1:53}" \
--set installCRDs=true \
--set webhook.hostNetwork=truehttps://cert-manager.io/docs/installation/helm/#steps
Choose a ACME provider of choice (DNS-01 is to prefer as the cluster won’t need to be externally exposed) https://cert-manager.io/docs/configuration/acme/dns01/#supported-dns01-providers and set up the challenge method.
A ClusterIssuer can look like this:
TSIGNAME= # name of the TSIG key
VALIDTSIGKEY= # a valid TSIG key to the dns server
CLUSTERISSUER=acme-prod # a name to refer your ClusterIssuer
SOADNS= # the IP of the primary DNS
TSIGALGO=HMACSHA512 # Choose something strong here

cat <<EOF |kubectl apply -f
---
apiVersion: v1
data:
  ${TSIGNAME}: ${VALIDTSIGKEY}
kind: Secret
metadata:
  name: ${TSIGNAME}
  namespace: cert-manager
type: Opaque
---
apiVersion: cert-manager.io/v1
kind: ClusterIssuer
metadata:
  name: ${CLUSTERISSUER}
spec:
  acme:
    email: ${VALIDEMAIL}
    preferredChain: ""
    privateKeySecretRef:
      name: certmanager-keyref
    server: https://acme-v02.api.letsencrypt.org/directory
    solvers:
    - dns01:
        rfc2136:
          nameserver: ${SOADNS}
          tsigAlgorithm: ${TSIGALGO}
          tsigKeyName: ${TSIGNAME}
          tsigSecretSecretRef:
            key: ${TSIGNAME}
            name: ${TSIGNAME}
EOF
Deploy Istio Bookinfo sample application
The Bookinfo sample application created by the Istio project is great to test out the abilities of the Gateway API, let’s deploy it:
kubectl apply -f \
https://raw.githubusercontent.com/istio/istio/\
release-1.13/samples/bookinfo/platform/kube/bookinfo.yaml
Configure Cilium Gateway API
In order to deploy the Gateway, we need to define a IP pool for the Service LoadBalancer and declare how to route/announce the IP through the network.
The concept around the BGP Control Plane, with LB Ipam, creates possibilities for having different routes on different nodes. I’m longing for native multi homing in Cilium but this could be a kind of (limited) alternative to route work load on node level. Btw, I’ve seen some happenings on the multi homing in the project so I feel optimistic that good things will happen with multi homing in the future.
Not really necessary in this specific environment (as the control plane is external and not affected), but needed in my demo environment where control plane and data plane live together, the BGP configuration below will only be applied to nodes with label bgp=worker:
Values from FRR declaration above
K8S_ROUTER_ASN= The AS Number defined for the Kubernetes cluster
LOCAL_ROUTER_ASN= AS Number defined for the router
LOCAL_ROUTER_HOSTCIDR= the /32 CIDR of the router

cat <<EOF |. kubectl apply -f -
---
apiVersion: cilium.io/v2alpha1
kind: CiliumLoadBalancerIPPool
metadata:
  name: ippool
spec:
  cidrs:
  - cidr: 10.245.12.0/24
  disabled: false
---
apiVersion: cilium.io/v2alpha1
kind: CiliumBGPPeeringPolicy
metadata:
  name: rack0
spec:
  nodeSelector:
    matchLabels:
      bgp: worker
  virtualRouters:
  - exportPodCIDR: true
    localASN: ${K8S_ROUTER_ASN}
    neighbors:
    - peerASN: ${LOCAL_ROUTER_ASN}
      peerAddress: ${LOCAL_ROUTER_HOSTCIDR}
    serviceSelector:
      matchExpressions:
      - key: somekey
        operator: NotIn
        values:
        - never-used-value
EOF
Test out TLS terminated HTTPRoutes
To test out the functionality of TLS terminated Gateway HTTPRoute resources this stanza can be used:
HTTPROUTEDOMAIN1=bookinfo.c1demo.ploio.net
HTTPROUTEDOMAIN2=hipstershop.c1dem.ploio.net
CLUSTERISSUER=acme-prod #Defined when choosing a provider for cert-manager


$ cat <<EOF | kubectl apply -f
---
apiVersion: gateway.networking.k8s.io/v1beta1
kind: Gateway
metadata:
  name: tls-gateway
  annotations:
    cert-manager.io/cluster-issuer: ${CLUSTERISSUER}
spec:
  gatewayClassName: cilium
  listeners:
  - name: https-1
    protocol: HTTPS
    port: 443
    hostname: "${HTTPROUTEDOMAIN1}"
    tls:
      certificateRefs:
      - kind: Secret
        name: demo-cert
  - name: https-2
    protocol: HTTPS
    port: 443
    hostname: "${HTTPROUTEDOMAIN2}"
    tls:
      certificateRefs:
      - kind: Secret
        name: demo-cert
---
apiVersion: gateway.networking.k8s.io/v1beta1
kind: HTTPRoute
metadata:
  name: https-app-route-1
spec:
  parentRefs:
  - name: tls-gateway
  hostnames:
  - "${HTTPROUTEDOMAIN1}"
  rules:
  - matches:
    - path:
        type: PathPrefix
        value: /details
    backendRefs:
    - name: details
      port: 9080
---
apiVersion: gateway.networking.k8s.io/v1beta1
kind: HTTPRoute
metadata:
  name: https-app-route-2
spec:
  parentRefs:
  - name: tls-gateway
  hostnames:
  - "${HTTPROUTEDOMAIN2}"
  rules:
  - matches:
    - path:
        type: PathPrefix
        value: /
    backendRefs:
    - name: productpage
      port: 9080
EOF
With this deployed there are one gateway and two httproutes in place,
$ kubectl get gateway
NAME          CLASS    ADDRESS        READY   AGE
tls-gateway   cilium   10.245.12.100   True    38m

$ kubectl get httproutes.gateway.networking.k8s.io
NAME                HOSTNAMES                                    AGE
https-app-route-1   ["bookinfo.c1demo.ploio.net"]      37m
https-app-route-2   ["hipstershop.c1demo.ploio.net"]   37m

$ kubectl get certificates.cert-manager.io
NAME        READY   SECRET      AGE
demo-cert   True    demo-cert   29m
The https-app-route-2 (“hipstershop”) will take us straight to / of the “productpage” Service on port 9080:
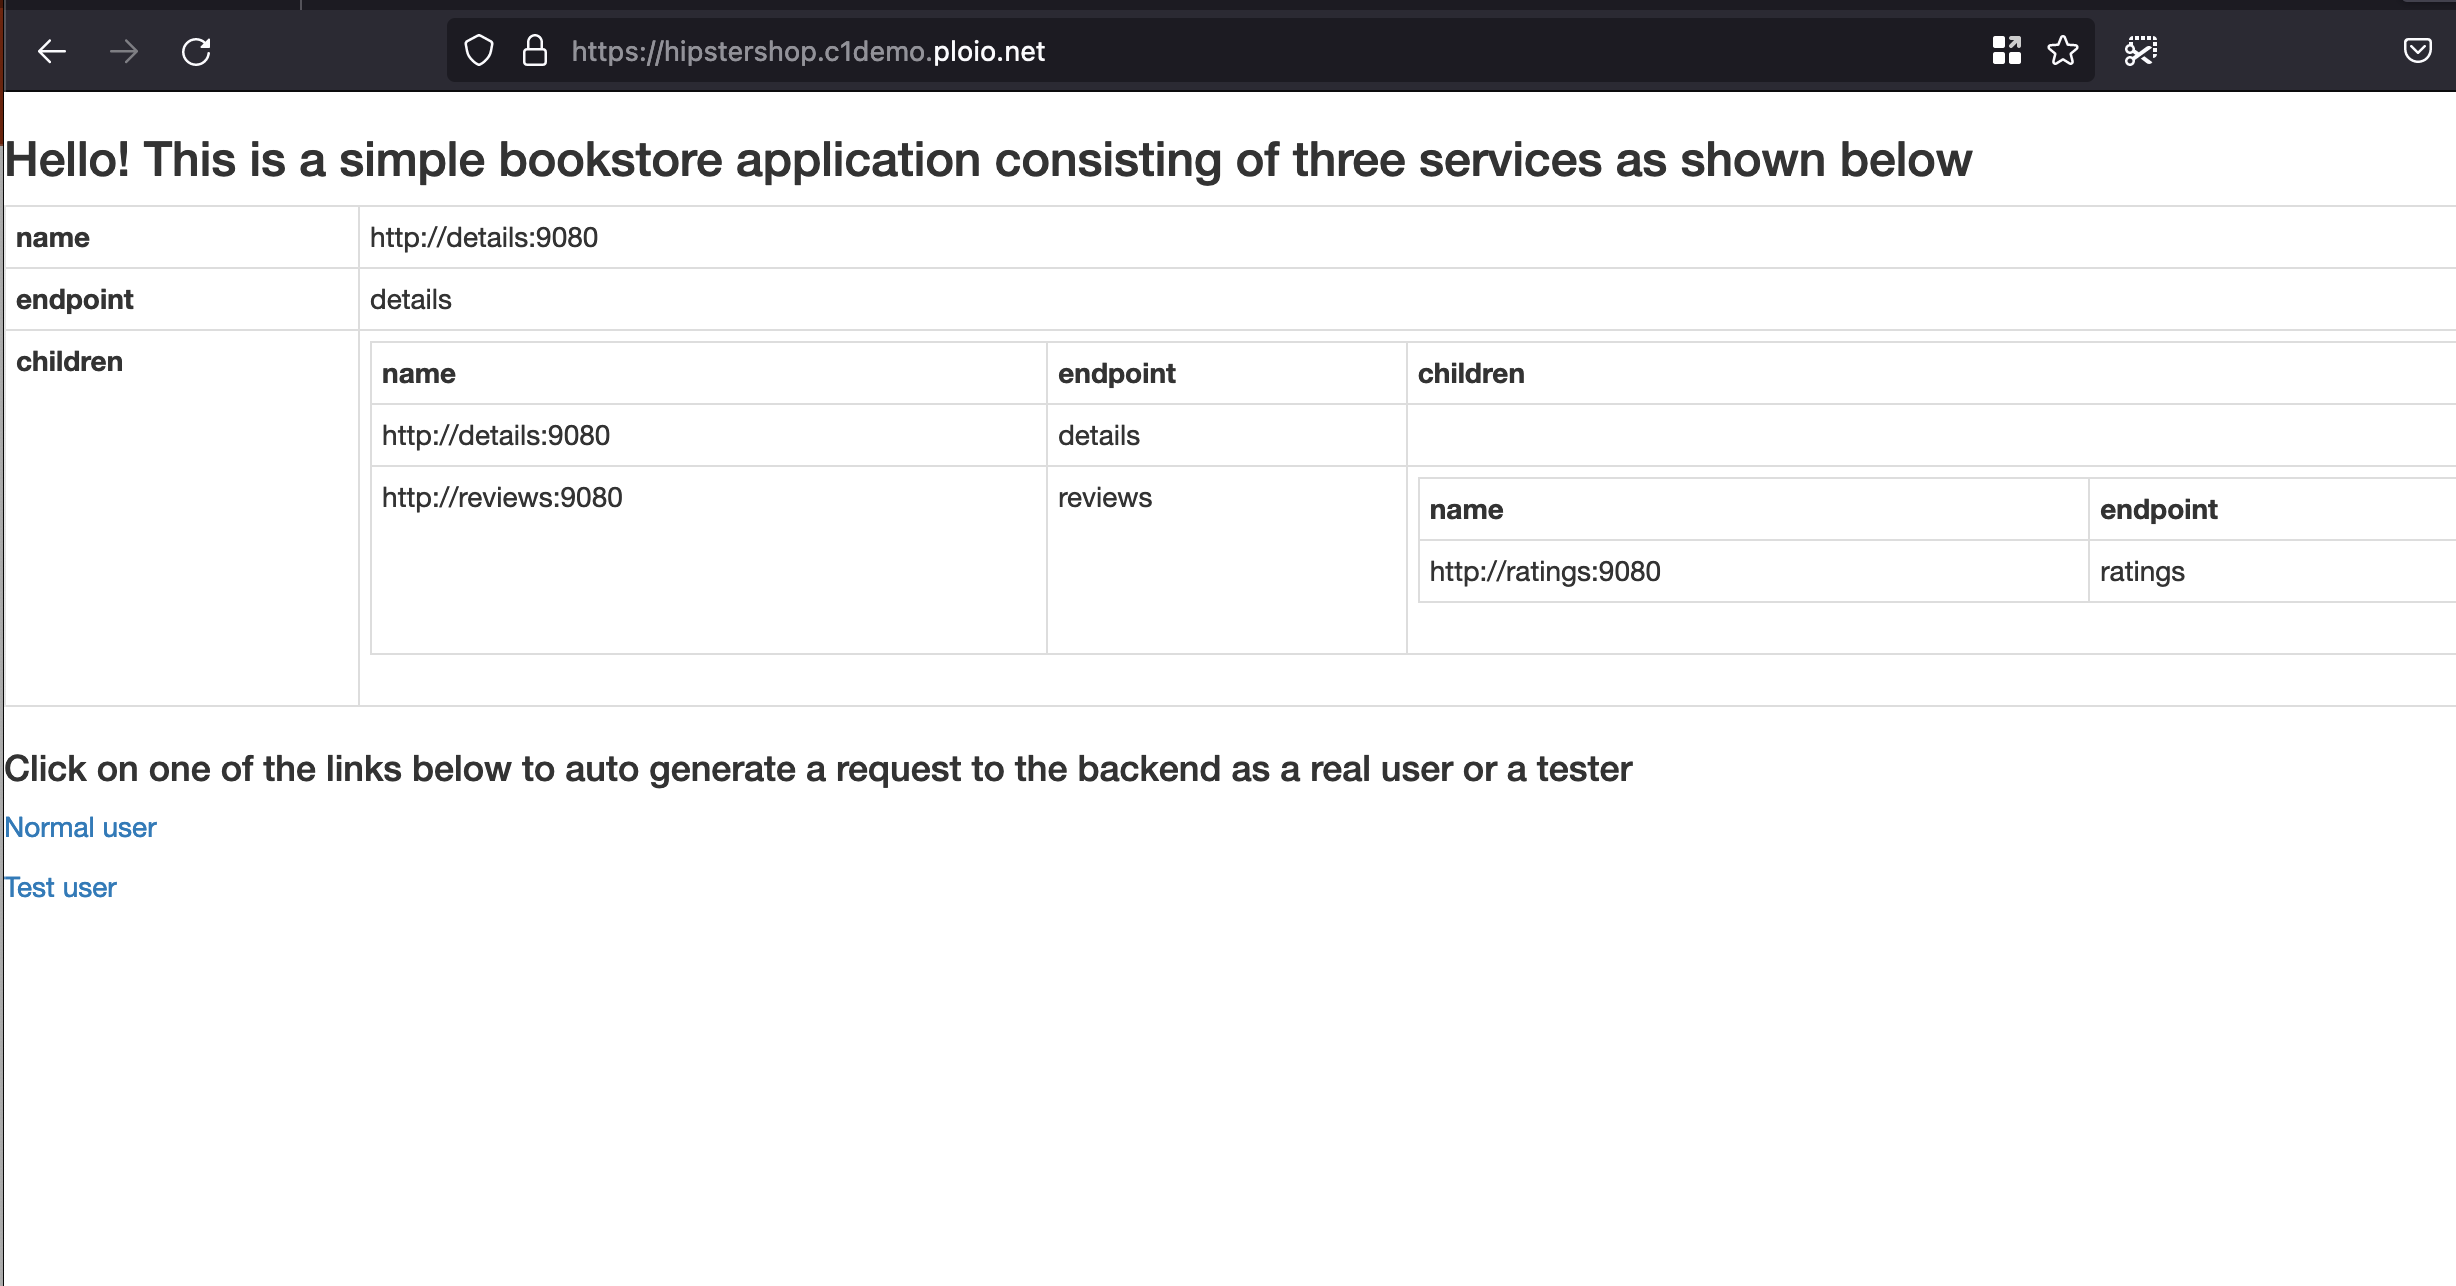
The https-app-route-2 (“bookinfo”), on the other hand, will only route on the /details (and below) and direct the HTTP traffic to the details Service on port 9080, thus a 404 on request to /:
$ curl -i https://bookinfo.c1demo.ploio.net/
HTTP/1.1 404 Not Found
date: Sat, 03 Jun 2023 14:01:43 GMT
server: envoy
content-length: 0
A request to /details will take us to the right path:
$ curl -i https://bookinfo.c1demo.ploio.net/details
HTTP/1.1 400 Bad Request
content-type: application/json
server: envoy
date: Sat, 03 Jun 2023 14:03:39 GMT
content-length: 45
x-envoy-upstream-service-time: 2

{"error":"please provide numeric product id"}%
Result when a valid path is fetched:

Deploy HTTP Gateway with HTTPRoute
In the same fashion, we will deploy a demo application to explore the the functionality of modifying headers and load balancing. We’ll do this with a simple HTTP Gateway HTTPRoute resource (no TLS termination and no hostname directive, accepting traffic directly to IP):
---
apiVersion: gateway.networking.k8s.io/v1beta1
kind: Gateway
metadata:
  annotations:
  name: my-gateway
  namespace: default
spec:
  gatewayClassName: cilium
  listeners:
  - allowedRoutes:
      namespaces:
        from: Same
    name: web-gw
    port: 80
    protocol: HTTP
---
apiVersion: gateway.networking.k8s.io/v1beta1
kind: HTTPRoute
metadata:
  name: http-app-1
  namespace: default
spec:
  parentRefs:
  - group: gateway.networking.k8s.io
    kind: Gateway
    name: my-gateway
    namespace: default
  rules:
  - filters:
    - requestHeaderModifier:
        add:
        - name: some-header
          value: This is fantastic
        set:
        - name: user-agent
          value: Mozilla/5.0 (compatible; Konqueror/3.5; SunOS) KHTML/3.5.0 (like
            Gecko)
      type: RequestHeaderModifier
    matches:
    - path:
        type: PathPrefix
        value: /
  - backendRefs:
    - group: ""
      kind: Service
      name: echo-1
      port: 8080
      weight: 100
    - group: ""
      kind: Service
      name: echo-2
      port: 8080
      weight: 0
    matches:
    - path:
        type: PathPrefix
        value: /
---
apiVersion: v1
kind: Service
metadata:
  labels:
    app: echo-1
  name: echo-1
  namespace: default
spec:
  ports:
  - name: high
    port: 8080
    protocol: TCP
    targetPort: 8080
  selector:
    app: echo-1
  sessionAffinity: None
  type: ClusterIP
---
apiVersion: v1
kind: Service
metadata:
  labels:
    app: echo-2
  name: echo-2
  namespace: default
spec:
  ports:
  - name: high
    port: 8080
    protocol: TCP
    targetPort: 8080
  selector:
    app: echo-2
  sessionAffinity: None
  type: ClusterIP
---
apiVersion: apps/v1
kind: Deployment
metadata:
  annotations:
  labels:
    app: echo-1
  name: echo-1
  namespace: default
spec:
  progressDeadlineSeconds: 600
  replicas: 1
  revisionHistoryLimit: 10
  selector:
    matchLabels:
      app: echo-1
  strategy:
    rollingUpdate:
      maxSurge: 25%
      maxUnavailable: 25%
    type: RollingUpdate
  template:
    metadata:
      creationTimestamp: null
      labels:
        app: echo-1
    spec:
      containers:
      - env:
        - name: NODE_NAME
          valueFrom:
            fieldRef:
              apiVersion: v1
              fieldPath: spec.nodeName
        - name: POD_NAME
          valueFrom:
            fieldRef:
              apiVersion: v1
              fieldPath: metadata.name
        - name: POD_NAMESPACE
          valueFrom:
            fieldRef:
              apiVersion: v1
              fieldPath: metadata.namespace
        - name: POD_IP
          valueFrom:
            fieldRef:
              apiVersion: v1
              fieldPath: status.podIP
        image: gcr.io/kubernetes-e2e-test-images/echoserver:2.2
        imagePullPolicy: IfNotPresent
        name: echo-1
        ports:
        - containerPort: 8080
          protocol: TCP
        resources: {}
        terminationMessagePath: /dev/termination-log
        terminationMessagePolicy: File
      dnsPolicy: ClusterFirst
      restartPolicy: Always
      schedulerName: default-scheduler
      securityContext: {}
      terminationGracePeriodSeconds: 30
---
apiVersion: apps/v1
kind: Deployment
metadata:
  annotations:
  labels:
    app: echo-2
  name: echo-2
  namespace: default
spec:
  progressDeadlineSeconds: 600
  replicas: 1
  revisionHistoryLimit: 10
  selector:
    matchLabels:
      app: echo-2
  strategy:
    rollingUpdate:
      maxSurge: 25%
      maxUnavailable: 25%
    type: RollingUpdate
  template:
    metadata:
      creationTimestamp: null
      labels:
        app: echo-2
    spec:
      containers:
      - env:
        - name: NODE_NAME
          valueFrom:
            fieldRef:
              apiVersion: v1
              fieldPath: spec.nodeName
        - name: POD_NAME
          valueFrom:
            fieldRef:
              apiVersion: v1
              fieldPath: metadata.name
        - name: POD_NAMESPACE
          valueFrom:
            fieldRef:
              apiVersion: v1
              fieldPath: metadata.namespace
        - name: POD_IP
          valueFrom:
            fieldRef:
              apiVersion: v1
              fieldPath: status.podIP
        image: gcr.io/kubernetes-e2e-test-images/echoserver:2.2
        imagePullPolicy: IfNotPresent
        name: echo-2
        ports:
        - containerPort: 8080
          protocol: TCP
        resources: {}
        terminationMessagePath: /dev/termination-log
        terminationMessagePolicy: File
      dnsPolicy: ClusterFirst
      restartPolicy: Always
      schedulerName: default-scheduler
      securityContext: {}
      terminationGracePeriodSeconds: 30
The result is a Gateway resource and HTTPRoute (without a hostname):
$ kubectl get httproutes.gateway.networking.k8s.io http-app-1
NAME         HOSTNAMES   AGE
http-app-1               41h

$ kubectl get gateway my-gateway
NAME         CLASS    ADDRESS        READY   AGE
my-gateway   cilium   10.245.12.48   True    41h
If we inspect the spec of HTTPRoute deployed, we can see that weight is 100 on echo-1 and 0 on echo-2, which means that all traffic is to be sent to echo-1. At the same time, we will change the request headers:
kubectl get httproutes.gateway.networking.k8s.io http-app-1 -o yaml | yq .spec
parentRefs:
  - group: gateway.networking.k8s.io
    kind: Gateway
    name: my-gateway
    namespace: default
rules:
  - filters:
      - requestHeaderModifier:
          add:
            - name: some-header
              value: This is fantastic
          set:
            - name: user-agent
              value: Mozilla/5.0 (compatible; Konqueror/3.5; SunOS) KHTML/3.5.0 (like Gecko)
        type: RequestHeaderModifier
    matches:
      - path:
          type: PathPrefix
          value: /
  - backendRefs:
      - group: ""
        kind: Service
        name: echo-1
        port: 8080
        weight: 100
      - group: ""
        kind: Service
        name: echo-2
        port: 8080
        weight: 0
    matches:
      - path:
          type: PathPrefix
          value: /
This is the corresponding output, where the request headers are changed, and the response comes from echo-1:
$ curl 10.245.12.48


Hostname: echo-1-78b66687b5-wzhbb

Pod Information:
 node name: worker2
 pod name: echo-1-78b66687b5-wzhbb
 pod namespace: default
 pod IP: 10.0.1.230

Server values:
 server_version=nginx: 1.12.2 - lua: 10010

Request Information:
 client_address=10.0.0.108
 method=GET
 real path=/
 query=
 request_version=1.1
 request_scheme=http
 request_uri=http://10.245.12.48:8080/

Request Headers:
 accept=*/*
 host=10.245.12.48
 some-header=This is fantastic
 user-agent=Mozilla/5.0 (compatible; Konqueror/3.5; SunOS) KHTML/3.5.0 (like Gecko)
 x-forwarded-proto=http
 x-request-id=c66720e5-d45b-40c5-943a-6377ffb4454c

Request Body:
 -no body in request-
If we scale up the amount requests, the pattern should be visible — everything is sent to echo-1:
$ :> gwapi.out && for i in {1..100}; do curl 10.248.8.169 >> gwapi.out &>/dev/null; done

$ grep -c Hostname gwapi.out
100

$ grep -c "Hostname: echo-1" gwapi.out
100

$ grep -c "Hostname: echo-2" gwapi.out
0
If we change the weights to 50 on each, the load should be spread out rather equally:
$ kubectl patch --type merge httproutes.gateway.networking.k8s.io http-app-1 -p '
{
  "spec": {
    "rules": [
      {
        "backendRefs": [
          {
            "name": "echo-1",
            "port": 8080,
            "weight": 50
          },
          {
            "name": "echo-2",
            "port": 8080,
            "weight": 50
          }
        ]
      }
    ]
  }
}'
httproute.gateway.networking.k8s.io/http-app-1 patched

$ :> gwapi.out && for i in {1..100}; do curl 10.248.8.169 >> gwapi.out &>/dev/null; done

$ grep -c Hostname gwapi.out
100

$ grep -c "Hostname: echo-1" gwapi.out
52

$ grep -c "Hostname: echo-2" gwapi.out
48
And finally, patching the echo-2 to have all the load is reflected when we curl the resource:
$ kubectl patch --type merge httproutes.gateway.networking.k8s.io http-app-1 -p '
{
  "spec": {
    "rules": [
      {
        "backendRefs": [
          {
            "name": "echo-1",
            "port": 8080,
            "weight": 0
          },
          {
            "name": "echo-2",
            "port": 8080,
            "weight": 100
          }
        ]
      }
    ]
  }
}'
httproute.gateway.networking.k8s.io/http-app-1 patched

$ :> gwapi.out && for i in {1..100}; do curl 10.248.8.169 >> gwapi.out &>/dev/null; done

$ grep -c "Hostname: echo-1" gwapi.out
0

$ grep -c "Hostname: echo-2" gwapi.out
100
Install OpenTelemetry Operator and OTel Collector
For this, we will install the operator and collector with values from the Isovalent Cilium Grafana Observability Demo repo.
First we install the OpenTelemetry Operator:
$ cat <<EOF | helm upgrade opentelemetry-operator\
 open-telemetry/opentelemetry-operator\
 --install --namespace opentelemetry-operator\
 --create-namespace --version 0.15.0 -f -
---
admissionWebhooks:
  create: false

manager:
  serviceMonitor:
    enabled: true
  env:
    ENABLE_WEBHOOKS: "false"
EOF
Install the OpenTelemetry Collector
cat <<EOF | kubectl apply -n opentelemetry-operator -f -
---
apiVersion: opentelemetry.io/v1alpha1
kind: OpenTelemetryCollector
metadata:
  name: otel
spec:
  mode: daemonset
  hostNetwork: true
  #image: otel/opentelemetry-collector-contrib:0.60.0
  image: ghcr.io/open-telemetry/opentelemetry-collector-releases/opentelemetry-collector-contrib:0.60.0
  config: |
    receivers:
      jaeger:
        protocols:
          grpc:
            endpoint: 0.0.0.0:14250
          thrift_http:
            endpoint: 0.0.0.0:14268
          thrift_compact:
            endpoint: 0.0.0.0:6831
      otlp:
        protocols:
          grpc:
            endpoint: 0.0.0.0:4317
          http:
            endpoint: 0.0.0.0:4318

    processors:
      batch: {}
      memory_limiter:
        check_interval: 5s
        limit_mib: 409
        spike_limit_mib: 128

    exporters:
      logging:
        loglevel: info
      otlp:
        endpoint: tempo.tempo.svc.cluster.local:4317
        tls:
          insecure: true

    service:
      telemetry:
        logs:
          level: info
          encoding: console
      pipelines:
        traces:
          receivers:
            - otlp
            - jaeger
          processors:
            - memory_limiter
            - batch
          exporters:
            - logging
            - otlp
EOF
With this in place we chould be able to collect traces.
Deploy Grafana Tempo
We will use Grafana Tempo as our front end for OpenTelemetry for having a look at the Hubble HTTP L7 traces.
$ cat << EOF > tempo-values.yaml
---
fullnameOverride: tempo

tempo:
  searchEnabled: true
EOF

$ helm upgrade tempo grafana/tempo --install \
--namespace tempo --create-namespace \
--create-namespace --version 0.16.2 -f tempo-values.yaml
Deploy Kube Prometheus Stack
Prometheus Operator will be installed with the kube-prometheus-stack helm template with some configuration for exemplars handling, dashboards and datasources:
GRAFANAFQDN=grafana.c1demo.ploio.net
GRAFANAPW=password # set something sensible here

cat <<EOF > prometheus-values.yaml
---
# nameOverride: prometheus-k8s
fullnameOverride: prometheus-k8s

prometheus:
  prometheusSpec:
    serviceMonitorSelectorNilUsesHelmValues: false
    podMonitorSelectorNilUsesHelmValues: false
    probeSelectorNilUsesHelmValues: false
    ruleSelectorNilUsesHelmValues: false

    enableRemoteWriteReceiver: true
    enableFeatures:
      - exemplar-storage
    externalLabels:
      cluster: kind
  ingress:
    enabled: false
    ingressClassName: cilium

defaultRules:
  rules:
    kubeProxy: false

alertmanager:
  ingress:
    enabled: false
    ingressClassName: cilium


kubeApiServer:
  tlsConfig:
    serverName: kubernetes
    insecureSkipVerify: true
grafana:
  enabled: true
  image:
    tag: 9.2.0

  serviceMonitor:
    enabled: true
  grafana.ini:
    server:
      domain: ${GRAFANAFQDN}
      root_url: "%(protocol)s://%(domain)s"
    feature_toggles:
      enable: 'tempoApmTable tempoBackendSearch'
  ingress:
    enabled: true
    ingressClassName: cilium
    hosts:
      - ${GRAFANAFQDN}
  dashboardProviders:
    dashboardproviders.yaml:
      apiVersion: 1
      providers:
      - name: 'cilium'
        orgId: 1
        folder: 'cilium'
        type: file
        disableDeletion: false
        editable: true
        options:
          path: /var/lib/grafana/dashboards/cilium

  dashboards:
    cilium:
      hubble:
        gnetId: 16613
        revision: 1
        datasource: Prometheus
      cilium-agent:
        gnetId: 16611
        revision: 1
        datasource: Prometheus
      cilium-operator:
        gnetId: 16612
        revision: 1
        datasource: Prometheus
      cilium-policies:
        gnetId: 18015
        revision: 4
        datasource:
        - name: DS_PROMETHEUS
          value: prometheus

  persistence:
    enabled: false

  adminUser: admin
  adminPassword: ${GRAFANAPW}


grafana:
  sidecar:
    skipTlsVerify: true
    dashboards:
      folderAnnotation: grafana_folder
      provider:
        foldersFromFilesStructure: true

    datasources:
      exemplarTraceIdDestinations:
        datasourceUid: tempo
        traceIdLabelName: traceID

  additionalDataSources:
    - name: Tempo
      type: tempo
      uid: tempo
      url: http://tempo.tempo:3100
      access: proxy
      jsonData:
        httpMethod: GET
        tracesToMetrics:
          datasourceUid: 'prometheus'
          tags: [{ key: 'service.name', value: 'service' }, { key: 'job' }]
          queries:
            - name: 'Sample query'
              query: 'sum(rate(tempo_spanmetrics_latency_bucket{$__tags}[5m]))'
        serviceMap:
          datasourceUid: 'prometheus'
        search:
          hide: false
        nodeGraph:
          enabled: true
EOF

$ helm repo add prometheus-community https://prometheus-community.github.io/helm-charts
$ helm repo update
$ helm upgrade kube-prometheus prometheus-community/kube-prometheus-stack --install --namespace monitoring --create-namespace --version 46.5.0 --values prometheus-values.yaml
Cilium Policy Verdicts Dashboard
Also, to visualise Cilium Network Policies, we installed the Policy Verdicts dashboard. This dashboard can really help us to tune the network policies to a zero trust level.
In my demo I deployed it manually as I had trouble to get it working from Grafana dashboard marketplace (for some reason it was unavailable at the moment), but normally as above in the helm values it would be installed at the same time as the others.
Deploy of OpenEBS for Persistent Storage
Some of the demo components really insisted for a PVC and I checked out OpenEBS and it turned out to be rather sleek (lets see in time if its a good as well):
$ kubectl apply -f https://openebs.github.io/charts/openebs-operator.yaml

$ kubectl patch storageclass openebs-hostpath -p '
{"metadata":
{"annotations":
{"storageclass.kubernetes.io/is-default-class":"true"}
}
}
'
The star of this show — “tenants app”
Either git clone the original demo app directly from Isovalent GH to play with some of the values, or clone my fork for some immediate action:
$ helm repo add minio https://operator.min.io
$ helm repo add strimzi https://strimzi.io/charts
$ helm repo add elastic https://helm.elastic.co
$ git clone https://github.com/tnorlin/cilium-grafana-observability-demo.git
$ cilium-grafana-observability-demo
$ helm dep build ./helm/jobs-app
$ helm upgrade jobs-app ./helm/jobs-app \
--install \
--wait \
--create-namespace \
--namespace tenant-jobs \
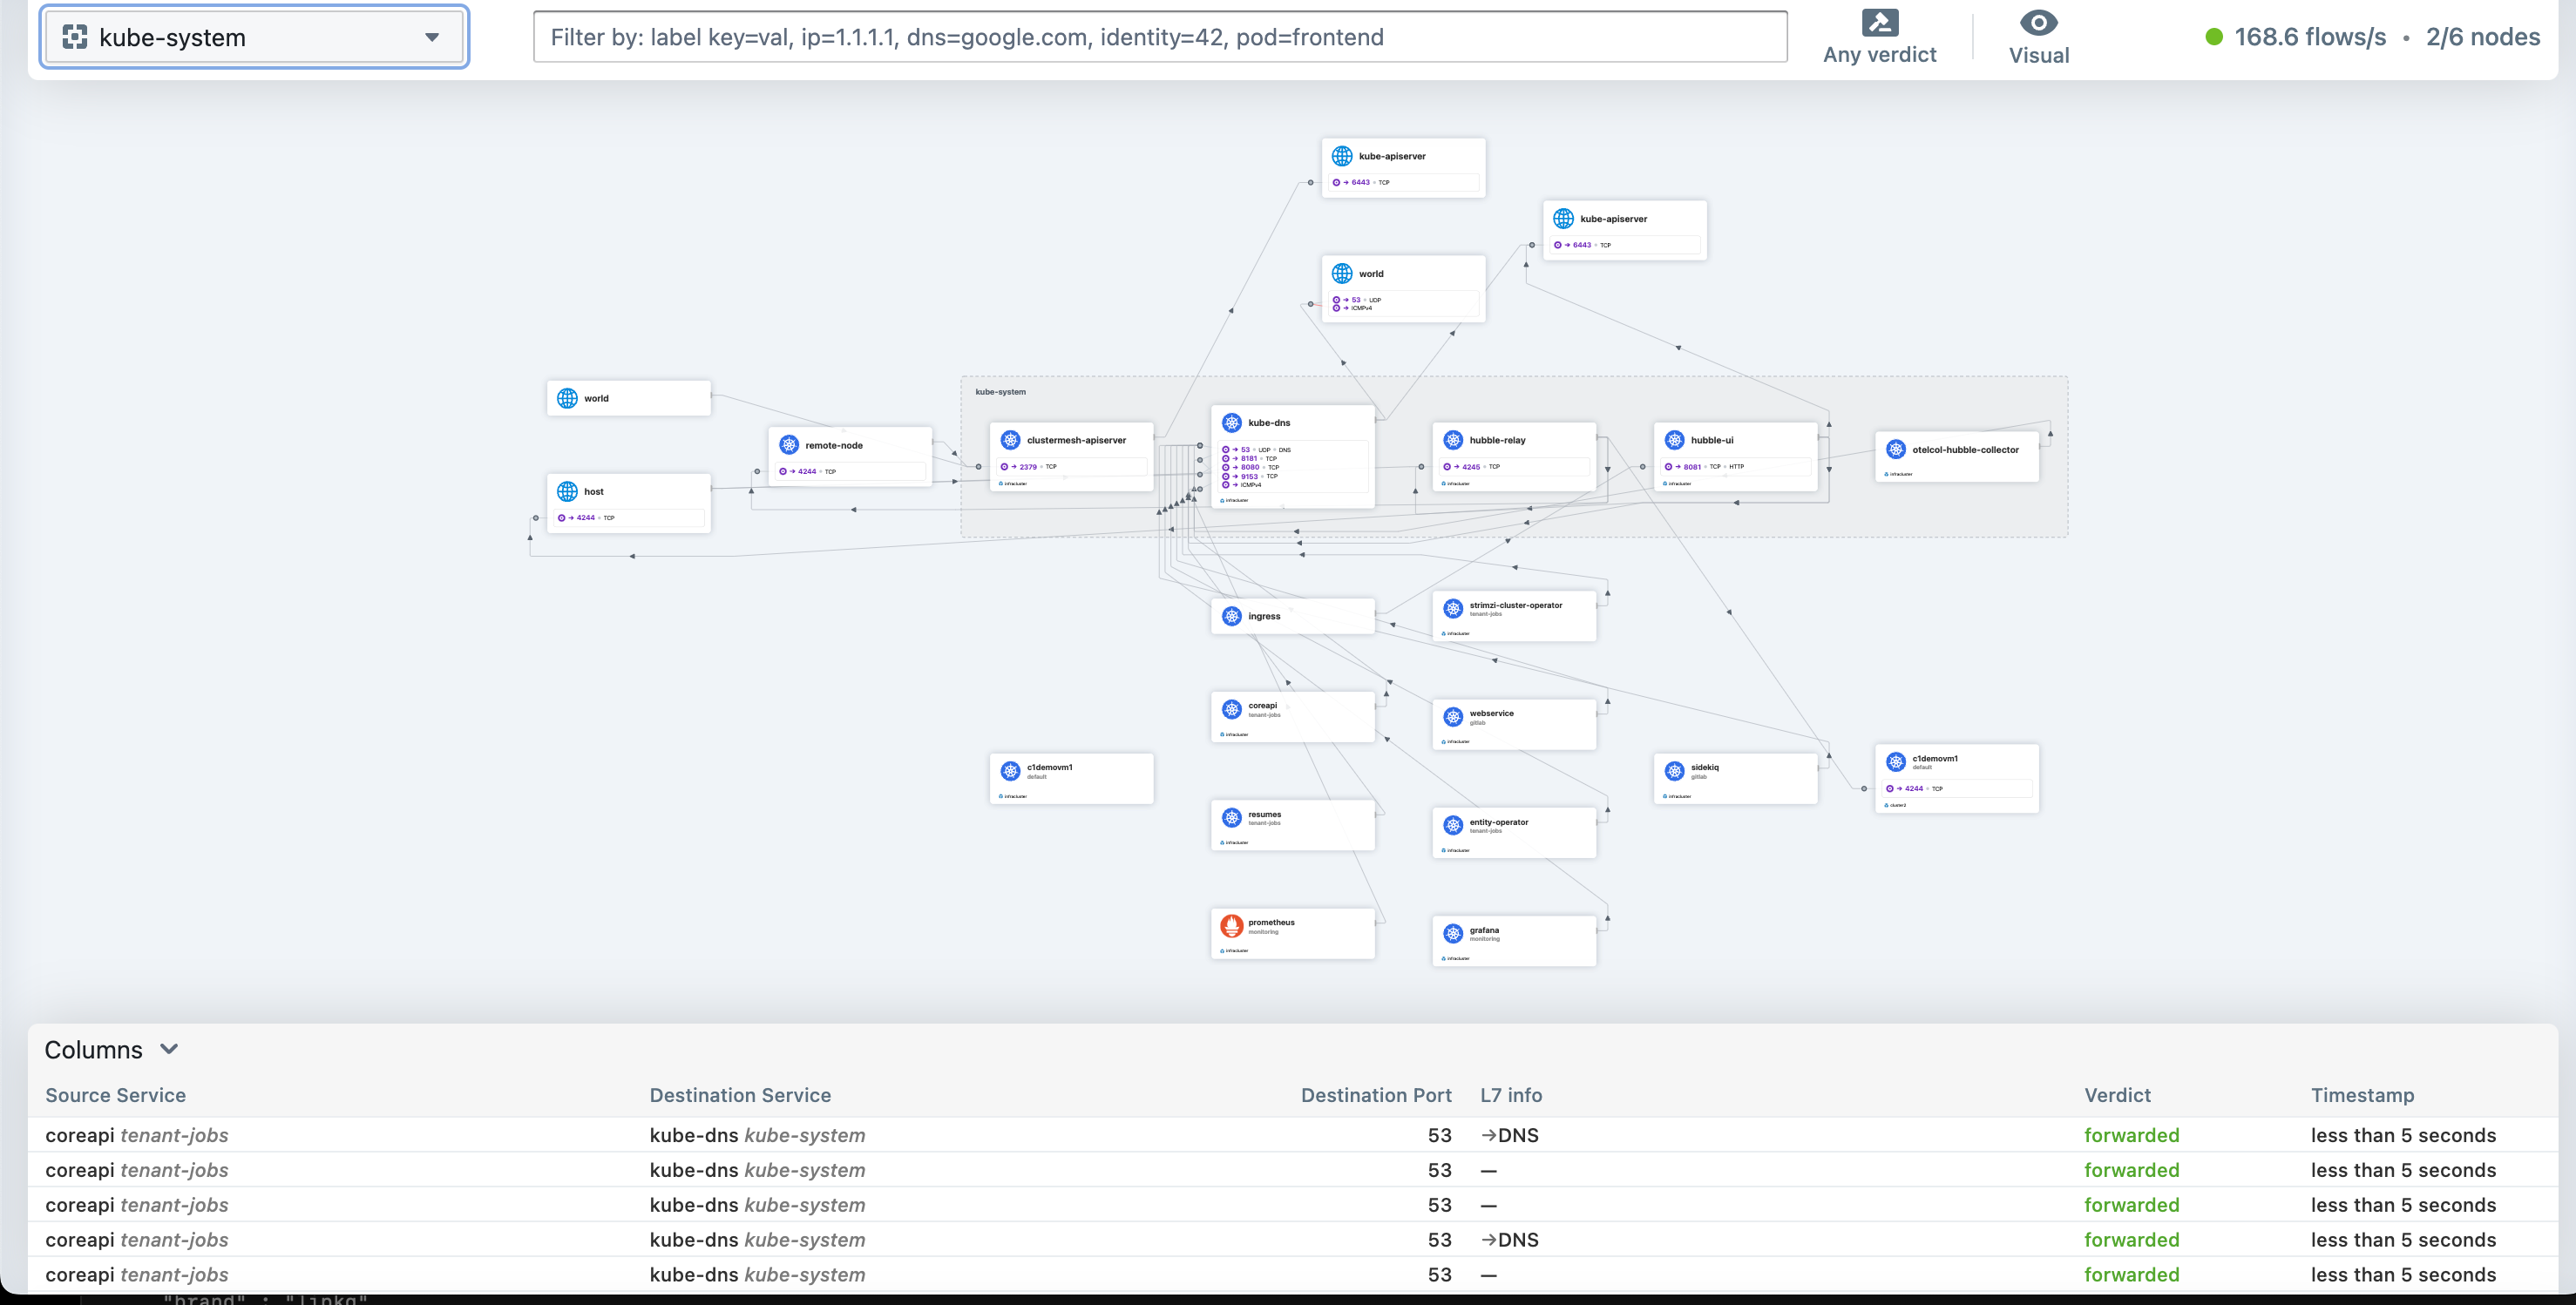
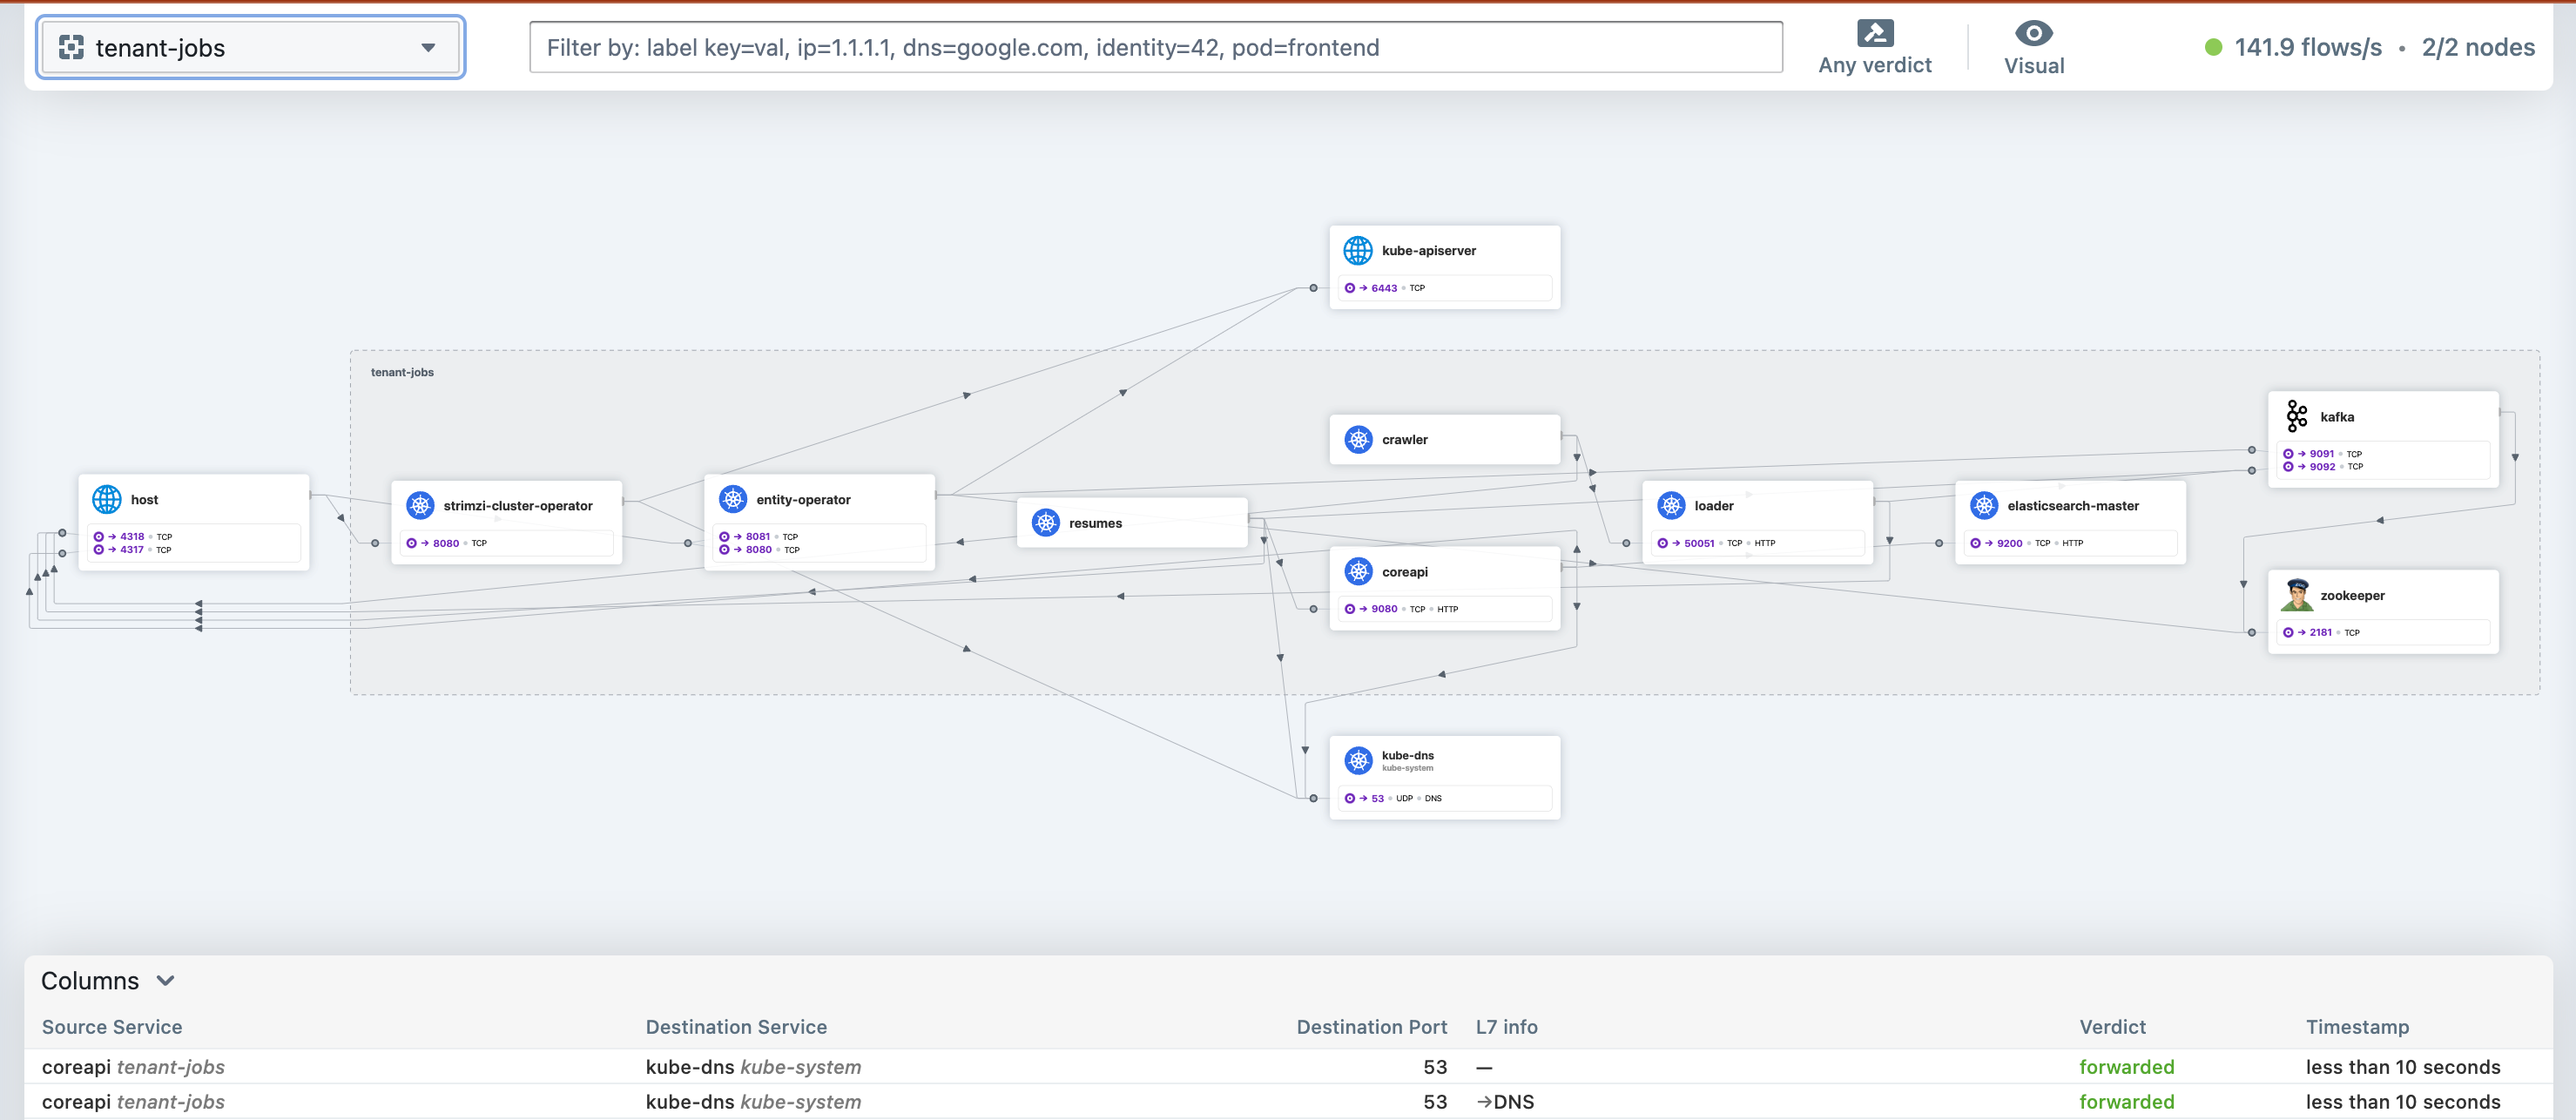
-f helm/jobs-app-values.yamlThe components should have stabilised after a couple of minutes and in Hubble a view similar to this should be visible:
To show Hubble, we can deploy a Cilium Ingress:
CLUSTERISSUER=acme-prod #Defined when choosing a provider for cert-manager
HUBBLEFQDN=

cat <<EOF | kubectl apply -f -
apiVersion: networking.k8s.io/v1
kind: Ingress
metadata:
  annotations:
    cert-manager.io/cluster-issuer: $(CLUSTERISSUER}
    external-dns.alpha.kubernetes.io/hostname: ${HUBBLEFQDN}
  name: hubble-ingress
  namespace: kube-system
spec:
  ingressClassName: cilium
  rules:
  - host: ${HUBBLEFQDN}
    http:
      paths:
      - backend:
          service:
            name: hubble-ui
            port:
              number: 80
        path: /
        pathType: Prefix
  tls:
  - hosts:
    - ${HUBBLEFQDN}
    secretName: hubbleui-tls-cert
EOF
Grafana
In Grafana we should have a bunch of dashboards, but one dashboard is particular of interest, the Hubble L7 HTTP dashboard, which show HTTP metrics along with examplars (the green “squares” in the bottom graph) from Grafana Tempo:
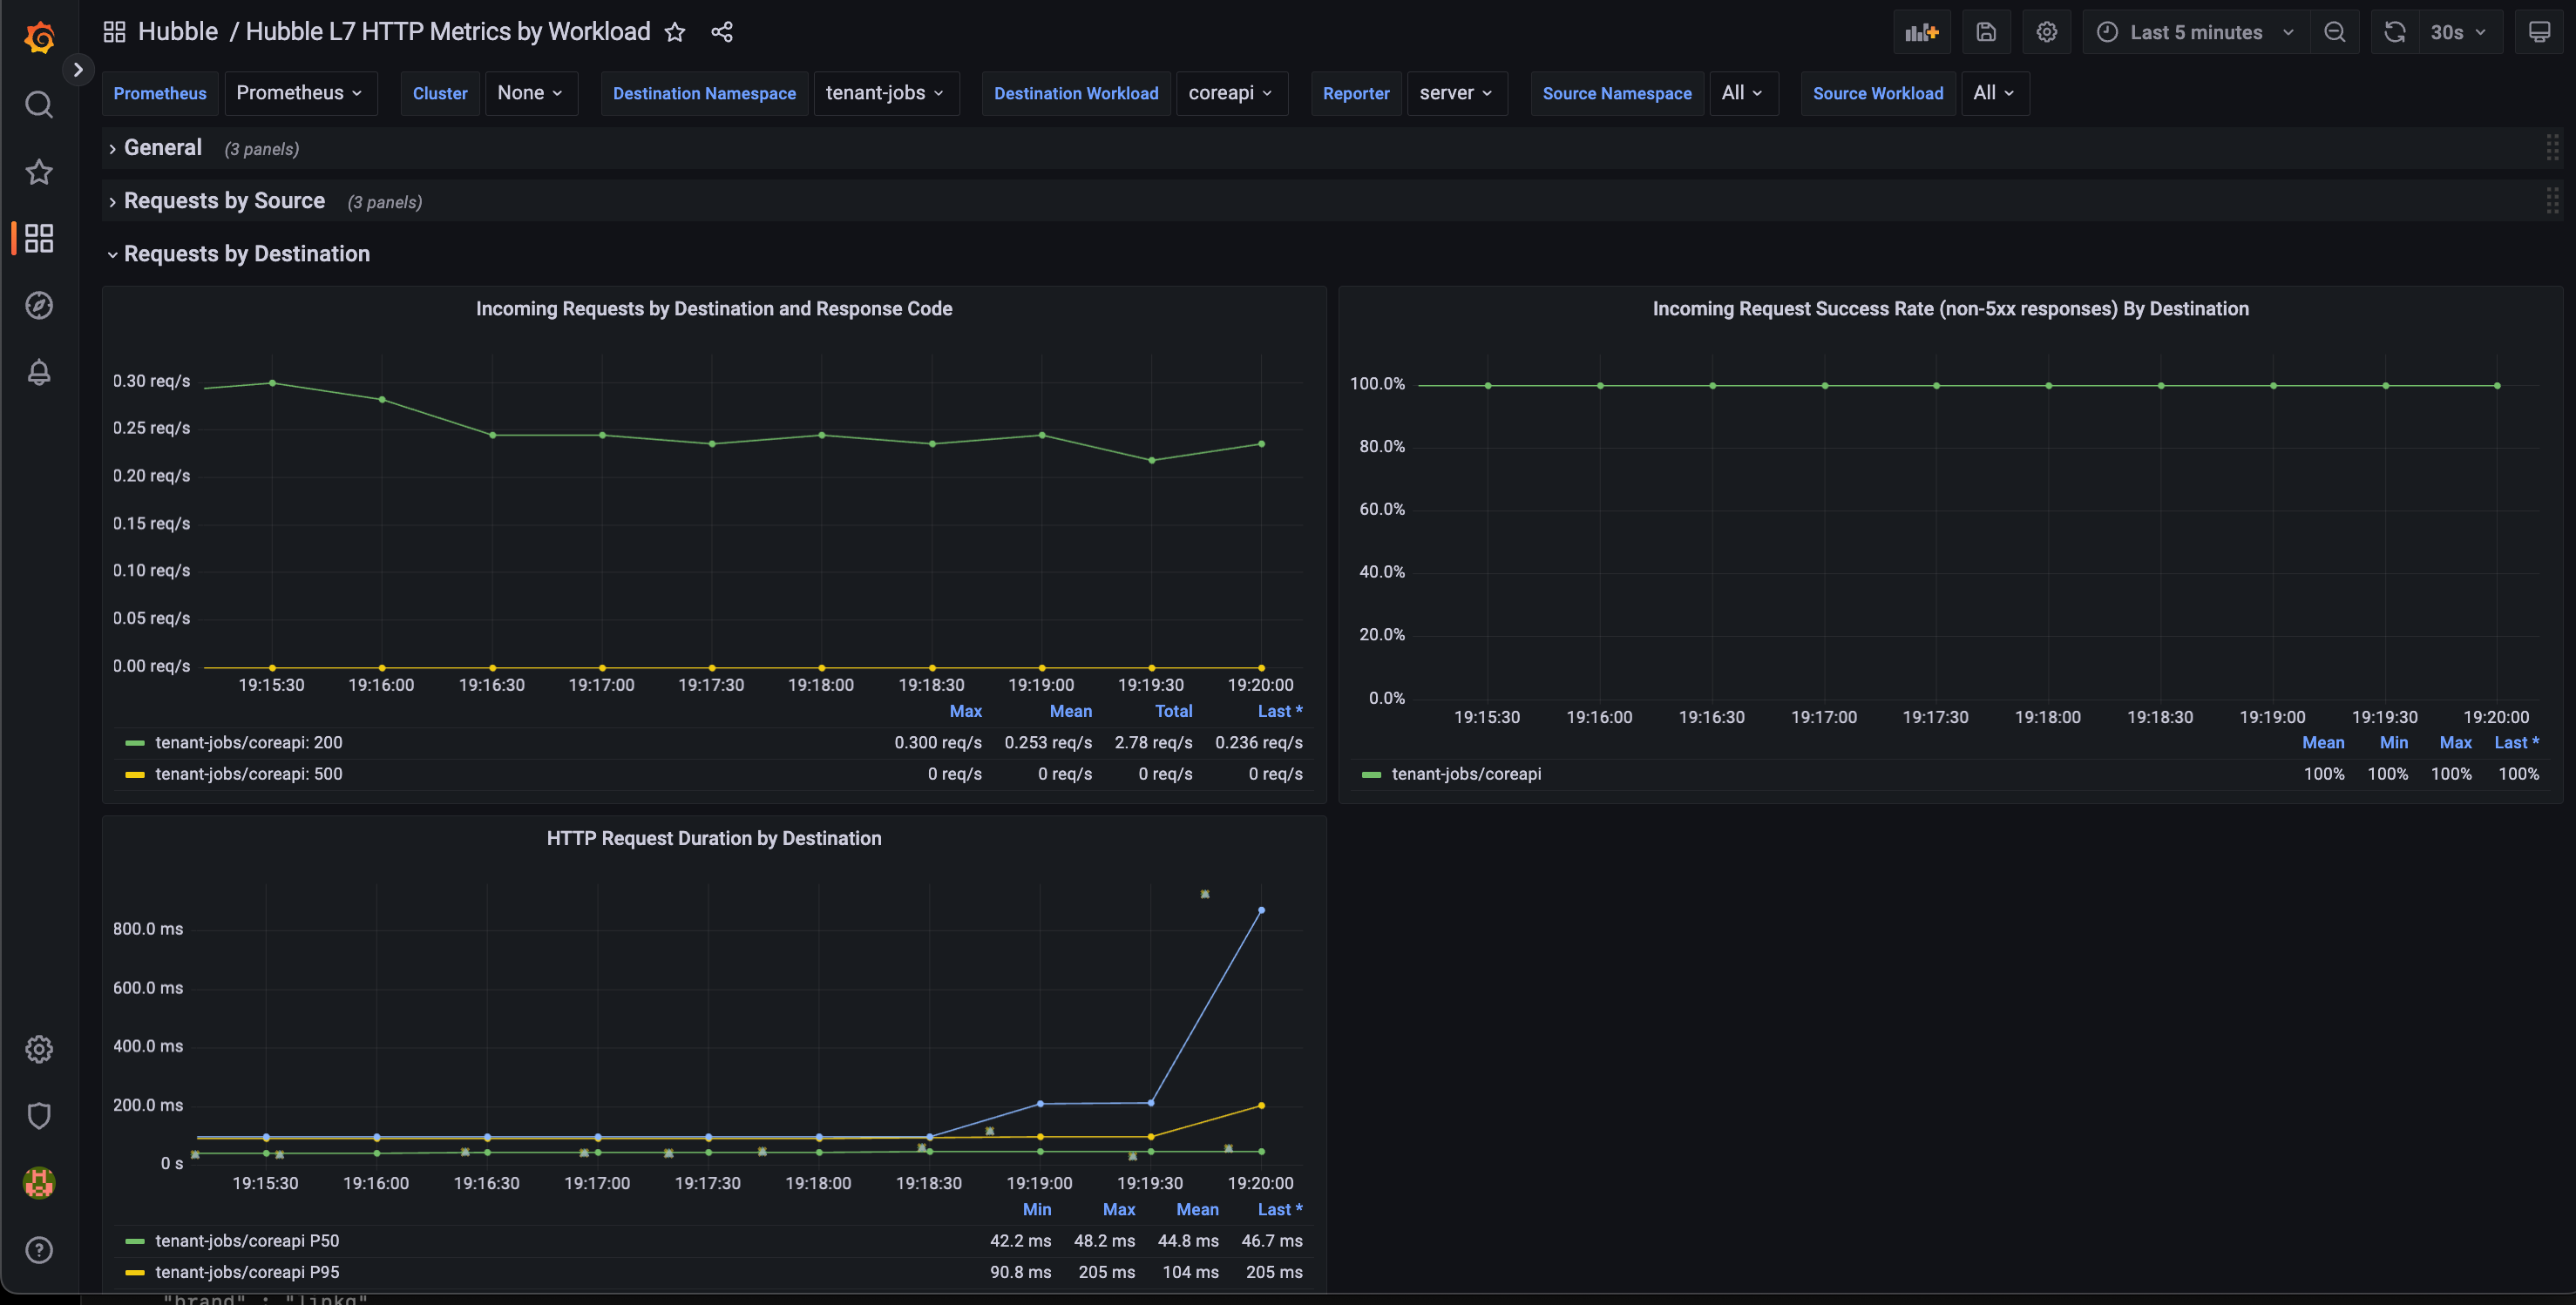
Hoovering an examplar would show something like this:

Example of a trace that got wrong:

Hubble Policy Verdicts
The Cilium Policy Verdicts dashboard, showing output from Hubble policy verdicts. This dashboard can be very helpful in the process of getting the network policies in a good shape by catching the traffic that doesn’t hit a defined rule:
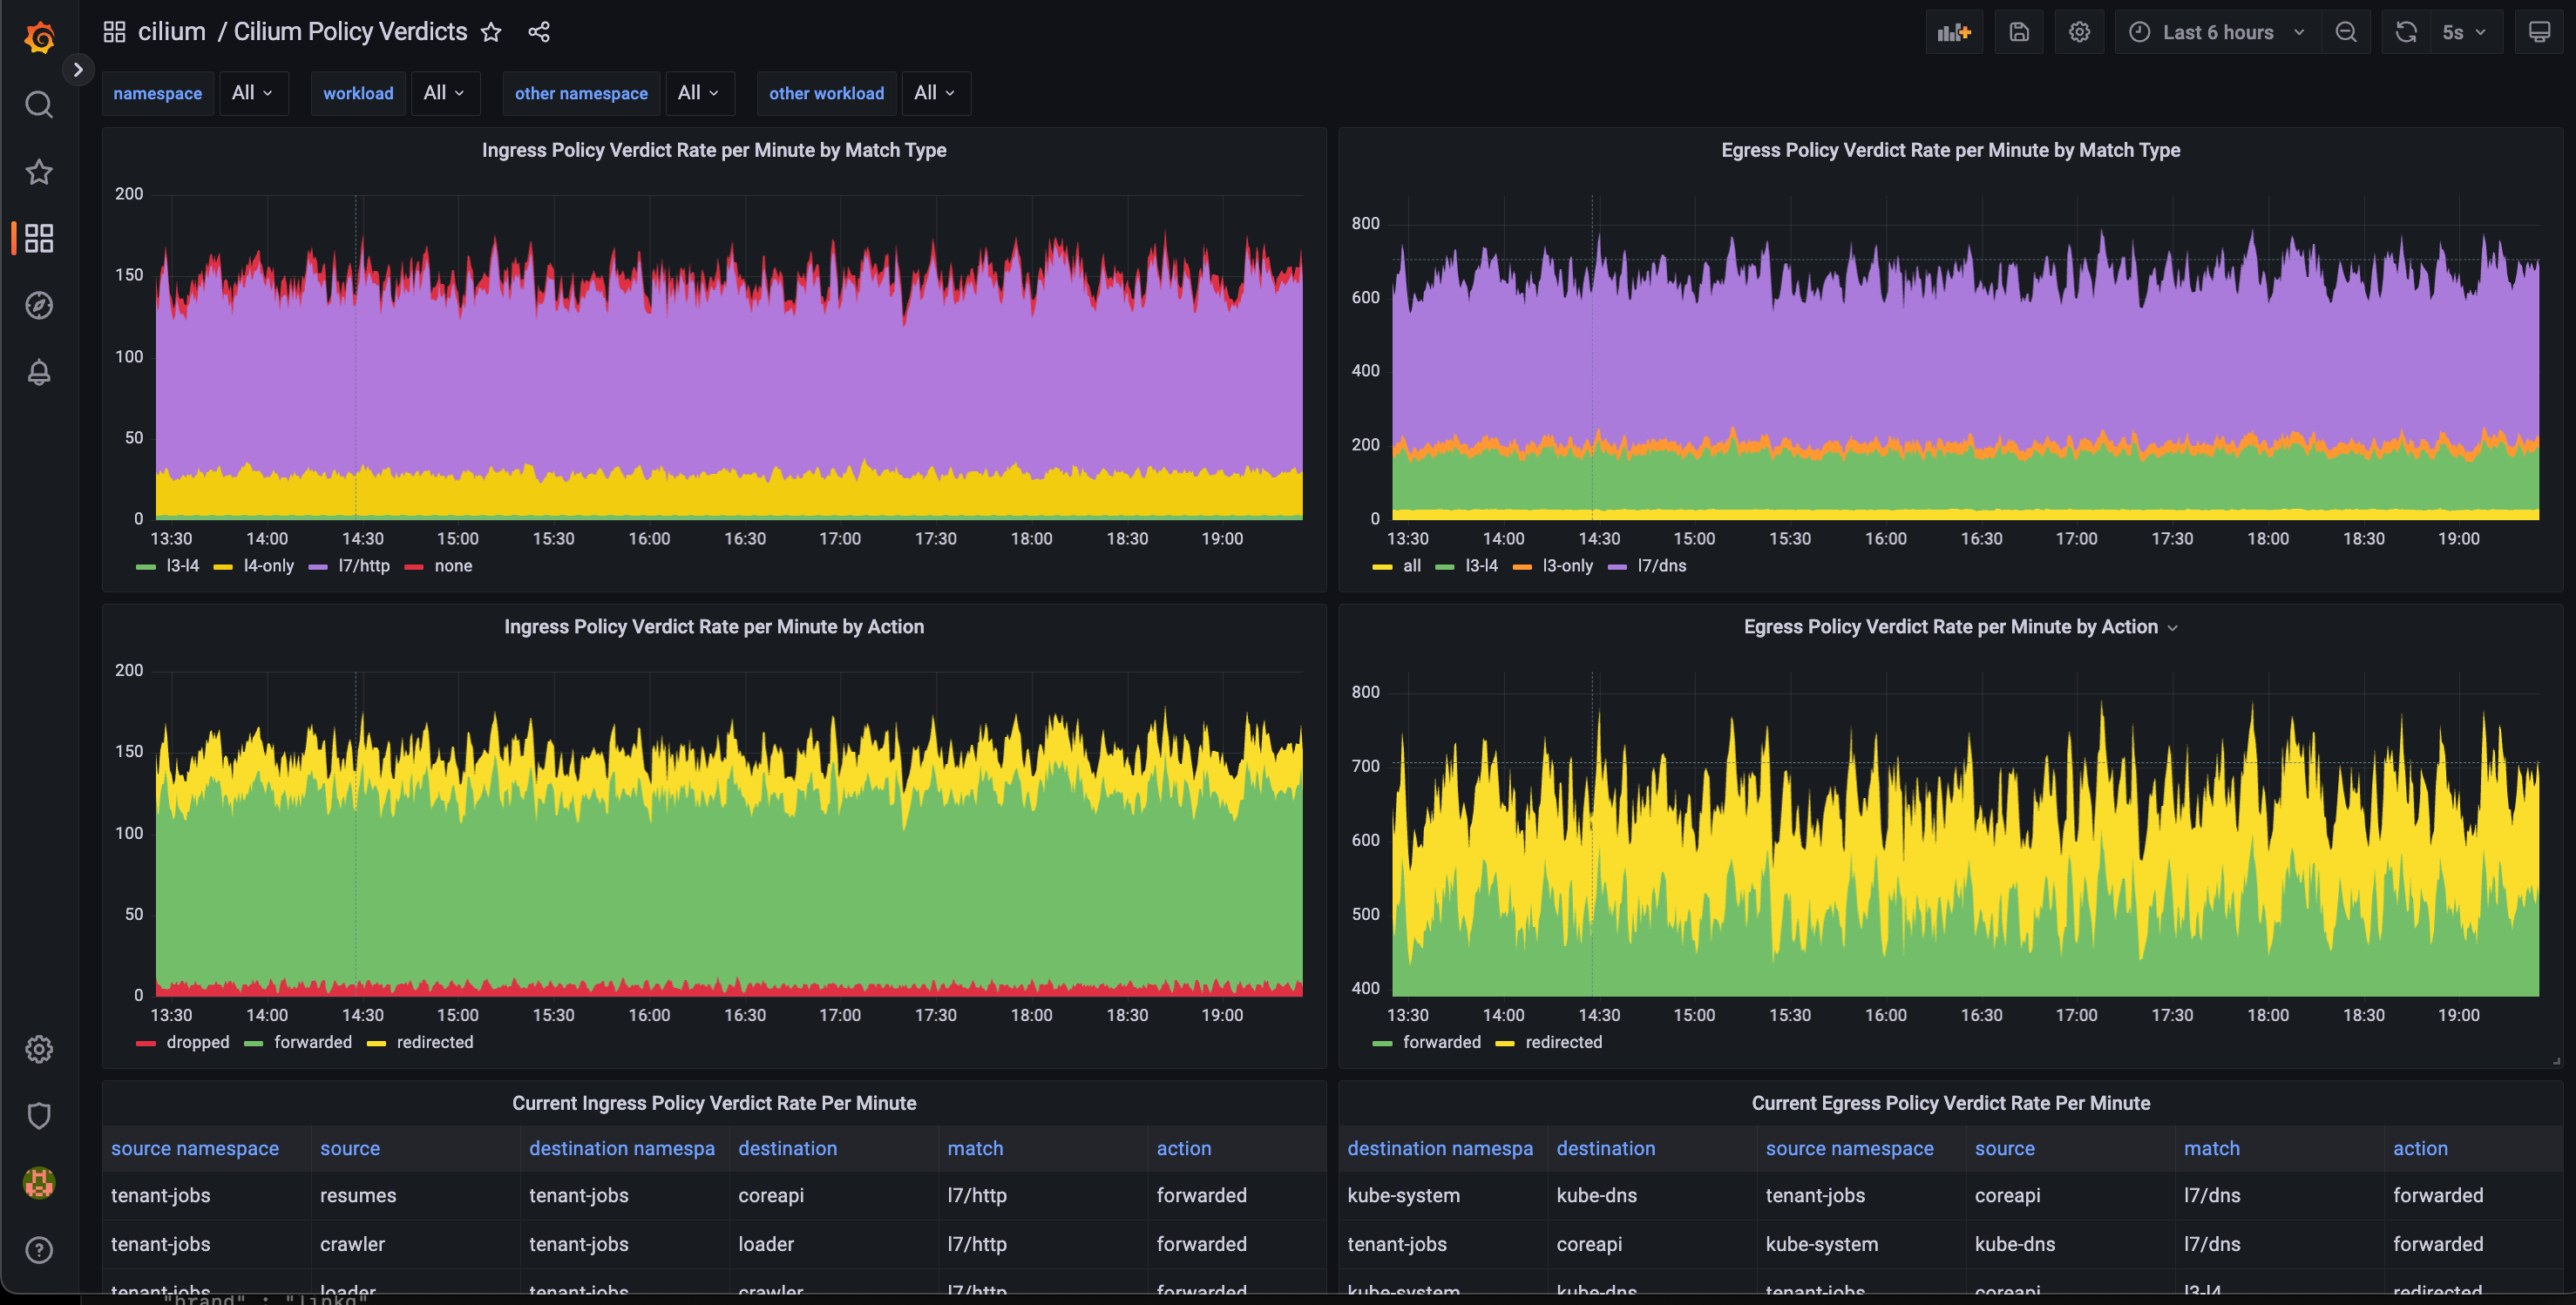
The policy verdicts can also be showed with the Hubble cli tool:
hubble observe --type policy-verdict -n tenant-jobs --last 5
Jun  3 17:34:08.849: tenant-jobs/strimzi-cluster-operator-6d4865c4d6-pnxwt:54352 (ID:109299) -> tenant-jobs/jobs-app-kafka-0:9091 (ID:126417) policy-verdict:L3-L4 INGRESS ALLOWED (TCP Flags: SYN)
Jun  3 17:34:08.910: tenant-jobs/strimzi-cluster-operator-6d4865c4d6-pnxwt:54354 (ID:109299) -> tenant-jobs/jobs-app-kafka-0:9091 (ID:126417) policy-verdict:L3-L4 INGRESS ALLOWED (TCP Flags: SYN)
Jun  3 17:34:09.067: tenant-jobs/strimzi-cluster-operator-6d4865c4d6-pnxwt:54356 (ID:109299) -> tenant-jobs/jobs-app-kafka-0:9091 (ID:126417) policy-verdict:L3-L4 INGRESS ALLOWED (TCP Flags: SYN)
Jun  3 17:34:09.100: tenant-jobs/strimzi-cluster-operator-6d4865c4d6-pnxwt:54358 (ID:109299) -> tenant-jobs/jobs-app-kafka-0:9091 (ID:126417) policy-verdict:L3-L4 INGRESS ALLOWED (TCP Flags: SYN)
Jun  3 17:35:10.079: tenant-jobs/jobs-app-entity-operator-6c69b669b6-gz7l8:56702 (ID:69972) -> tenant-jobs/jobs-app-kafka-0:9091 (ID:126417) policy-verdict:L3-L4 INGRESS ALLOWED (TCP Flags: SYN)
Jun  3 17:35:44.034: tenant-jobs/strimzi-cluster-operator-6d4865c4d6-pnxwt:59206 (ID:109299) -> 10.20.14.20:6443 (ID:16777217) policy-verdict:all EGRESS ALLOWED (TCP Flags: SYN)
Jun  3 17:35:49.889: 10.0.1.248:59578 (host) -> tenant-jobs/jobs-app-entity-operator-6c69b669b6-gz7l8:8080 (ID:69972) policy-verdict:L4-Only INGRESS ALLOWED (TCP Flags: SYN)
Jun  3 17:35:49.889: 10.0.1.248:55716 (host) -> tenant-jobs/jobs-app-entity-operator-6c69b669b6-gz7l8:8081 (ID:69972) policy-verdict:L4-Only INGRESS ALLOWED (TCP Flags: SYN)
Jun  3 17:35:49.889: 10.0.248:55714 (host) -> tenant-jobs/jobs-app-entity-operator-6c69b669b6-gz7l8:8081 (ID:69972) policy-verdict:L4-Only INGRESS ALLOWED (TCP Flags: SYN)
Jun  3 17:35:49.889: 10.0.1.248:59572 (host) -> tenant-jobs/jobs-app-entity-operator-6c69b669b6-gz7l8:8080 (ID:69972) policy-verdict:L4-Only INGRESS ALLOWED (TCP Flags: SYN)
And that was about what I had time to demo during my show time (we have limited amount of time ~35 minutes for presentation, demo and Q&A).
Cilium Mesh (almost there)
Wait, there’s more to it, I was out of time during the demo, but my preparations went a bit further. I had installed another (ordinary) kubernetes Cluster with Cluster Mesh enabled and also connected an external workload (a VM) to the cluster.
Output from the vm running docker:
root@c1demovm1:~# cilium status
KVStore:                 Ok         etcd: 1/1 connected, lease-ID=7c02888260c64b1d, lock lease-ID=7c02888260c64b1f, has-quorum=true: https://clustermesh-apiserver.cilium.io:2379 - 3.5.4 (Leader)
Kubernetes:              Disabled
Host firewall:           Disabled
CNI Chaining:            none
CNI Config file:         CNI configuration file management disabled
Cilium:                  Ok   1.13.3 (v1.13.3-36cb0eed)
NodeMonitor:             Listening for events on 4 CPUs with 64x4096 of shared memory
Cilium health daemon:    Ok
IPAM:                    IPv4: 1/2 allocated from 10.190.1.0/30, IPv6: 1/4294967294 allocated from f00d::a14:0:0:0/96
IPv6 BIG TCP:            Disabled
BandwidthManager:        Disabled
Host Routing:            Legacy
Masquerading:            IPTables [IPv4: Enabled, IPv6: Enabled]
Controller Status:       17/17 healthy
Proxy Status:            OK, ip 10.190.1.2, 0 redirects active on ports 10000-20000
Global Identity Range:   min 256, max 65535
Hubble:                  Disabled
Encryption:              Disabled
Cluster health:             Probe disabled
In one of the clusters, the vm is visible
$ kubectl get ciliumnode
NAME           CILIUMINTERNALIP   INTERNALIP     AGE
c1demovm1      10.190.1.2         10.20.21.20    103s
worker1        10.0.0.114         172.22.5.31    2d4h
worker3        10.0.1.248         172.22.5.33    2d4h
The vm can do DNS lookups in the cluster
root@c1demovm1:~# nslookup -norecurse hubble-ui.kube-system.svc.cluster.local
Server:  10.192.0.10
Address: 10.192.0.10#53

Name: hubble-ui.kube-system.svc.cluster.local
Address: 10.195.247.135
Also, the vm can connect to resources in the cluster
curl echo-1.default.svc.cluster.local:8080


Hostname: echo-1-78b66687b5-wzhbb

Pod Information:
 node name: worker3
 pod name: echo-1-78b66687b5-wzhbb
 pod namespace: default
 pod IP: 10.0.1.230

Server values:
 server_version=nginx: 1.12.2 - lua: 10010

Request Information:
 client_address=10.190.1.2
 method=GET
 real path=/
 query=
 request_version=1.1
 request_scheme=http
 request_uri=http://echo-1.default.svc.cluster.local:8080/

Request Headers:
 accept=*/*
 host=echo-1.default.svc.cluster.local:8080
 user-agent=curl/7.81.0

Request Body:
 -no body in request-
During KubeConEU, Liz Rice showed us an amazing teaser about the future Cilium Mesh and this little piece (screen shot) captured my interest.

This functionality is not in the mainline Cilium (not at least from what I’ve seen), but hopefully something that will land in the next release of Cilium OSS (v1.14) — cilium endpoint add —name= —labels= —ip=. Without the possibility to declare new endpoints, I’ve yet to find good ways to integrate the vm into the cluster (but the other way around seem to work well).
Well, that’s about it for this time, in the next part I planned to dive a little deeper into some of the parts as there are more to it, especially when it comes to Policy Verdicts and Cluster Mesh.
What did you think about this article? Did I get anything wrong or bad? Spelling mistakes? Will you try out some of the functionality yourself?
Please react|comment|share if you liked the article or else found it useful. I hope it will inspire you to test out at least some of the features.
I’ve had hopes to create an inspiring bare metal cluster with the Turing PI v2 and a couple of Raspberry Pi CM4, hopefully with some kind of a node auto scaler — but you’ll have to bare with my modest demo environment as we’ll have to wait until Q4 for the CM4 to restock…